So, we live in the time domain, right? That’s where we measure all things digital. But here’s the cool part: sometimes, instead of taking the usual route, we can speed things up by cruising through the frequency domain. Now, to break it down, there are six principles that help us make sense of how an online oscilloscope switches up time domain measurements to give us a peek into the frequency domain.
Online oscilloscope equipped with a Fast Fourier Transform (FFT) function employ all six principles “behind the curtain.” It’s like our shortcut to a different view, making the complex seem a bit more straightforward.
The Spectrum Results by Combining Sine Wave Elements
Alright, so in the frequency domain talk, we’re keeping it simple. We will only be dealing with sine waves. Although there are other waveforms like Legendre polynomials, Hermite polynomials, and wavelets, we’re shining a spotlight on sine waves for a reason.
These waves solve second-order, linear, and differential equations. You know, the kind of equations that pop up all the time in electrical circuits with resistors, capacitors, and inductors.
So, when we’re messing with RLC circuits, it turns out describing things using a mix of sine waves just makes life easier.

Repeatedly Appending a Waveform to Itself Results in a Periodic Waveform
Okay, let’s break down this whole time domain to the frequency domain. When we transform a waveform from the time domain to the frequency domain, it’s like converting a bunch of data into a team of sine waves. Each of these waves has its own frequency, amplitude, and phase.
Now, in the time zone, we describe our measurements with a total acquisition time (let’s call it T) and the time between samples (∆T). But once we jump to the frequency zone, we start calling this collection of sine waves the “spectrum.”
However, we are limited to applying the Discrete Fourier Transform (DFT) strictly to periodic V(t) waveforms. We need to artificially make it periodic if it isn’t already. By taking the acquisition buffer of total time, T, and repeating it indefinitely in the past and future, we may transform any random acquisition buffer of observed data into a periodic waveform.
With this artificially recurrent waveform, we can use the DFT’s capabilities to mathematically compute every frequency element in the spectrum. We use the following formulas to determine the phase and amplitude of each frequency element.

A Spectrum Only Contains Discrete Frequencies, With the Fundamental Frequency Being the Lowest
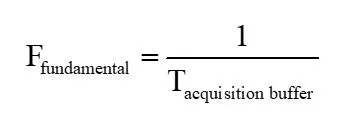
There are only discrete frequency values in the computed spectrum. The basic element is the component with the lowest frequency. We were able to fit the lowest frequency sine wave into the acquisition buffer time. The entire acquisition time, T, is equal to the period, P, of this sine wave with the lowest frequency.
Given that P and T are equal, the fundamental frequency becomes

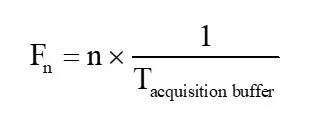
The frequencies of every frequency element in the spectrum are all just integer multiples of the fundamental:

The sole frequency elements we will observe in the spectrum are multiples of the fundamental. This indicates that the fundamental frequency is the frequency interval, or resolution, between each frequency component.
We must utilize a longer online oscilloscope acquisition time in case we need a higher resolution to identify closely spaced frequency components in the spectrum.
The Nyquist, or Half the Sample Rate, Has the Highest Frequency
The time interval between each point sampled in the buffer is connected to the highest frequency element in the spectrum. To determine the amplitude and phase of the frequency component, we must, at the very least, measure two V(t) points in a single period. This indicates that Pmax = 2 x △T, or twice the time interval, is the period of the greatest frequency sine wave that we can compute.

The Nyquist frequency is another name for the highest-frequency element in the spectrum. Since the Nyquist frequency is 1/△T, the sample rate used to take data, the greatest frequency for which a sine wave component can be calculated is half of the sampling rate. The Nyquist frequency is 5 GHz if the sample rate is 10 GS/s.
An ideal sine wave’s average value is always zero. This indicates that the mean of the time-domain waveform generated when a genuine waveform is described using a set of sine waves is always a value of 0. Online oscilloscope
However, actual waveforms have a DC offset or average value. We keep the DC component in the 0 Hz frequency component, or 0 × the fundamental, to account for this. Most oscilloscopes allow you to zoom in on the display’s scale by suppressing the plotting of the 0th frequency component.
The Fourier Theorem Accelerates Calculation by Reducing the Buffer to 2^n Sample Points
To construct a single spectrum, one million data points would require around one trillion DFT calculations. Calculating this might take longer than is practical. We employ the FFT, a far quicker version of the DFT, to get around this issue. It uses matrix math to conduct the same integral computations as the DFT but with a total number of points that is a power of two.
The maximum number of points that could be included in the FFT calculation if there are one million points in the buffer, is 2^19 = 524,288 points. In order to achieve extremely rapid computing time, we discard about half of the measured data.
The first step in performing an FFT is determining the area of the acquisition buffer that contains the greatest number of 2^n points. The majority of oscilloscopes let you count from the left edge or select the middle area of the time-domain screen.

We anticipate the fundamental to be 1 MHz when we have one million points and an acquisition buffer period of 1 µs. The real resolution is marginally greater than 1 MHz since the FFT acquisition buffer is smaller in the spectrum. However, these approximations remain a useful tool to consider the spectrum’s characteristics.
Functions of Windowing Avoid Spectral Leaks Related to Truncation
To obtain a periodic waveform, we used the acquisition buffer and cycled it endlessly.
We minimized the acquisition buffer and repeated the reduced buffer indefinitely while using the FFT function. This means that the waveform may discontinue at the boundaries of each added acquisition buffer, marking the end of one buffer and the start of the next.

A sine wave with an integral number of cycles in each buffer often exhibits a single frequency surge at its peak frequency in its spectrum. Nevertheless, the infinitely long waveform will now have a discontinuity that will push some of the frequency elements from the peak frequency into adjacent frequency components. Reducing the acquisition buffer may potentially distort the small peak if the sine wave is artificially cut off.
We refer to this phenomenon as spectral leakage. It is an artifact of the inconsistency caused by the initial and last voltage values not being the same at the buffer boundaries. Multiplying the entire acquisition buffer by a window function can artificially reduce the discontinuity to mitigate this effect. This ensures that the beginning of one buffer and the end of the next are continuous by gradually forcing the voltage level at each end of the acquisition buffer to equal 0.
Many windowing functions are frequently utilized. Their respective spectral leakage allowances and resolutions vary. We advise using the Blackman-Harris or von Hann functions wherever possible unless there is an extremely good reason not to.
Summing Up
In conclusion, delving into online oscilloscope and Fourier Analysis unveils six core principles shaping the shift from time to frequency domains. Through the exploration of sine waves, the establishment of periodicity, and the recognition of discrete frequencies, we gain valuable insights. Armed with tools such as the Fourier Theorem and strategic windowing functions, we easily navigate the complexities. This newfound understanding transforms waveform analysis into an educational journey, making the intricate world of digital measurements more accessible.
