
A audio spectrum analyzer online is a tool that lets users upload or input signals, like audio files or live audio feeds. It then processes these signals and shows the frequency spectrum graphically, usually using a graph or a spectrogram. Spectrum audio analyzers offer many advanced features that enhance signal analysis and provide valuable insights into audio signals.
Advanced Features of Spectrum Audio Analyzer Online
Here are some advanced features of audio spectrum analyzer online that enable users like you to perform intricate signal analysis, visualize spectral data with precision, and optimize audio signals for various applications ranging from live sound reinforcement to studio recording and post-production mastering.
- Audio Signal Processing

In audio signal processing, one of the most remarkable and advanced features of the audio spectrum analyzer online is its ability to conduct spectral analysis. This process involves separating different frequency components of an audio signal, including speech and music.
After dissecting the signal in this manner, audio engineers and producers can gain valuable insights into the composition and structure of the sound. This feature is particularly useful in music production, where precise manipulation of frequencies is essential for achieving desired effects and enhancing overall audio quality.
2. Biomedical Signal Processing

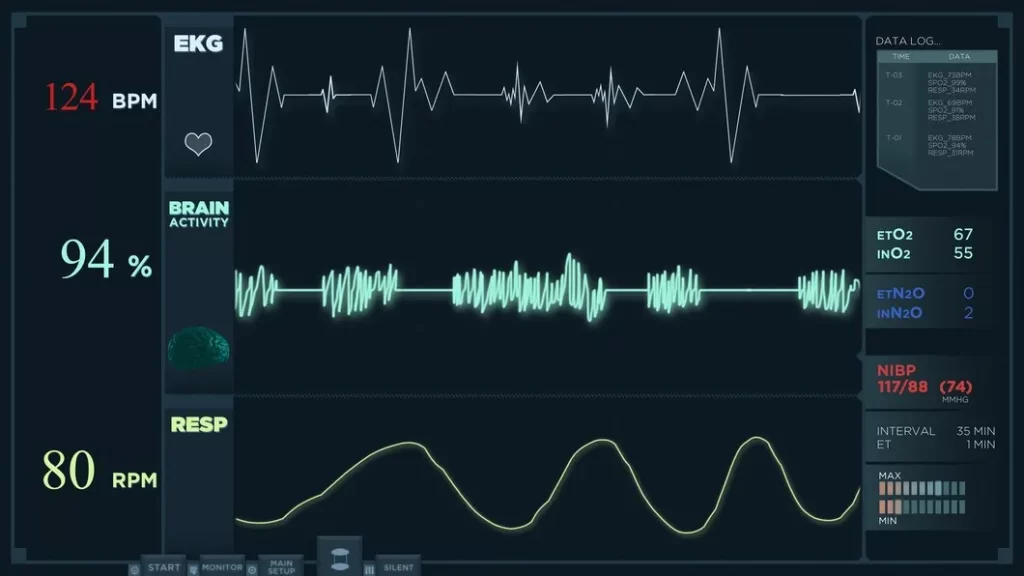
The spectrum audio analyzer’s spectral analysis capabilities in biomedical signal processing can help analyze signals from medical devices like electrocardiograms (ECGs) and electroencephalography (EEGs).
For instance, in the case of ECG signals, spectral analysis helps identify irregular heart rhythms and abnormalities in cardiac activity, enabling timely intervention and treatment. The spectral analysis of these signals helps healthcare professionals detect abnormalities and diagnose various medical conditions more accurately.
3. Spectrogram Visualization
A spectrogram is like a picture that shows how the different frequencies in a signal change over time. It’s made up of a graph where time is shown on the horizontal axis (x-axis) and frequency is shown on the vertical axis (y-axis).
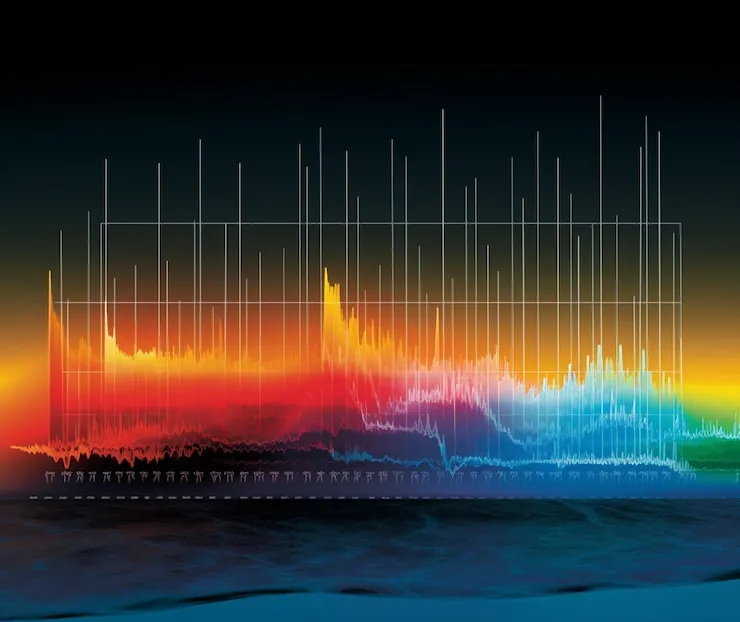
Advanced spectrum analyzers incorporate spectrogram visualization, representing frequencies’ intensity over time. This advanced feature is a must-have. It allows users to identify transient events, track frequency variations, and detect patterns within the audio signal more effectively than traditional spectrum graphs.
4. FFT Windowing and Averaging
These analyzers should employ advanced algorithms such as Fast Fourier Transform (FFT) windowing and averaging techniques to enhance spectral resolution and reduce noise interference. An FFT transform breaks down a signal’s representation from how it changes over time to its frequency makeup. This helps analyze the different frequencies present in the signal. Looking at the frequency domain can reveal if a signal that looks clear over time actually has interference, noise, or irregularities..
FFT windowing helps mitigate spectral leakage and improve frequency resolution while averaging techniques enable extracting meaningful data from noisy signals by smoothing out fluctuations.
5. Adjustable Resolution and Bandwidth

Users can adjust spectrum analyzers’ resolution and bandwidth settings to focus on specific frequency ranges or enhance spectral detail according to their requirements. This flexibility allows for targeted analysis of particular frequency bands and facilitates the identification of subtle nuances within complex audio signals.
6. Peak Hold and Max Hold Functions

Peak and max hold functions enable users to capture and display the maximum amplitude peaks within the frequency spectrum over a defined period. This feature is handy for identifying transient or sustained peaks in the audio signal, aiding in dynamic range analysis and monitoring peak levels.
7. Comprehensive Signal Processing Functionalities
These tools empower users to manipulate and refine audio signals within the analyzer interface directly, streamlining the analysis and optimization wor
kflow. Here are some of the functionalities explained:
- Filtering

Filtering is a fundamental signal processing tool that enables the isolation or removal of specific frequencies within a signal. With spectrum analyzers, users can apply various filter types such as low-pass, high-pass, band-pass, and band-reject filters to extract or eliminate unwanted frequencies. This capability is particularly useful for noise reduction, signal enhancement, and isolating specific components within complex signals.
- Equalization
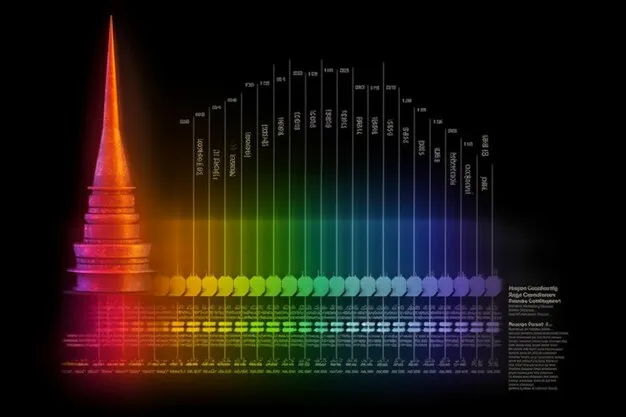
Equalization adjusts the frequency response of audio signals to achieve desired tonal balance and clarity. Spectrum analyzers offer equalization functionalities that allow users to modify the amplitude characteristics across different frequency bands. By boosting or attenuating specific frequencies, equalization helps in compensating for room acoustics, correcting speaker deficiencies, and tailoring the sound to meet specific preferences or standards.
- Harmonic Analysis
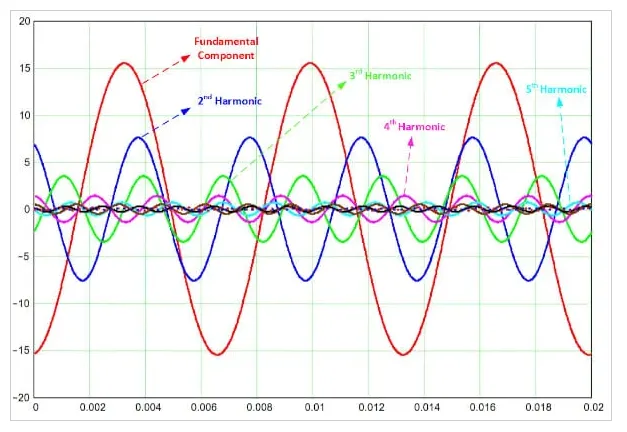
Harmonic analysis involves the examination and quantification of harmonic content present within a signal. Harmonics are integer multiples of the fundamental frequency and often contribute to the timbre and character of audio signals. Spectrum analyzers equipped with harmonic analysis tools enable users to identify, visualize, and analyze harmonic components accurately. This capability is essential in audio engineering, music production, and troubleshooting applications where understanding harmonic content is critical for signal quality assessment and optimization.
8. Weather and Stock Market Forecasting
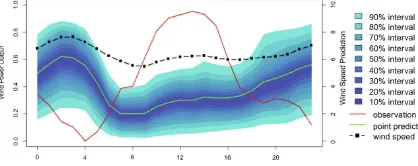
In weather forecasting, the advanced feature of spectral analysis of weather data enables meteorologists to discern underlying patterns and trends in meteorological variables, facilitating more accurate predictions of future weather patterns and events. Similarly, in stock market forecasting, spectral analysis of financial data allows analysts to identify recurring patterns and trends in stock prices, aiding in predicting future market movements and investment decisions.

